New York, November 2-8, 2026: weekly data digest
The week of November 2-8, 2026 in New York, on one page. Each section computes the week's total or average from its own official data, with the previous week and the same week last year when the data exists. Published after the week ends; it does not change afterwards.
Page updated: Current page
The period at a glance
- 67.0 °F Average high Over November 2-8, 2026, the daily high at Central Park averaged 67.0 °F (19 °C), 9.3 °F above normal (National Weather Service, November 8, 2026).
- 72,122 Requests 311 received 72,122 service requests over November 2-8, 2026 (NYC Open Data, 311 service requests, November 8, 2026).
- 3 Stories We published 3 stories over November 2-8, 2026; the most are in Weather (newyork24, November 8, 2026).
WeatherData date:
Central Park weather: November 2-8, 2026
- Average high
- 67.0 °Fnormal 57.7 °F
- Average low
- 53.3 °F12 °C
- Warmest day
- 72 °FNovember 4
- Coldest day
- 43 °FNovember 2
- Precipitation
- 0.91 inperiod total
Over November 2-8, 2026, the daily high at Central Park averaged 67.0 °F (19 °C) and the daily low averaged 53.3 °F (12 °C).
The highest temperature of the period was 72 °F on November 4; the lowest was 43 °F on November 2.
The average daily high was 9.3 °F above the average normal high for the same days (57.7 °F).
Precipitation totaled 0.91 inches, with measurable amounts on 2 of 7 days.
Average high: 63.4 °F in the previous week (October 26 - November 1, 2026); this period is 3.6 °F higher.
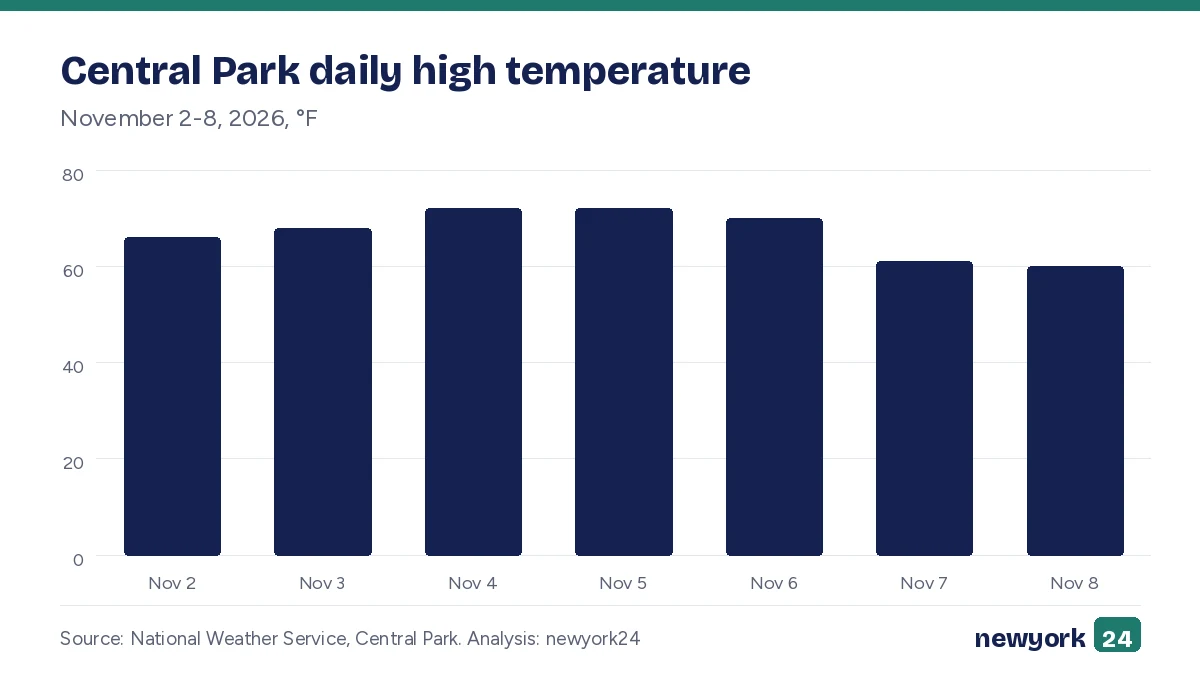
Source: National Weather Service. Figures are the National Weather Service's final daily climate reports for Central Park; normals cover 1991-2020.
City servicesData date:
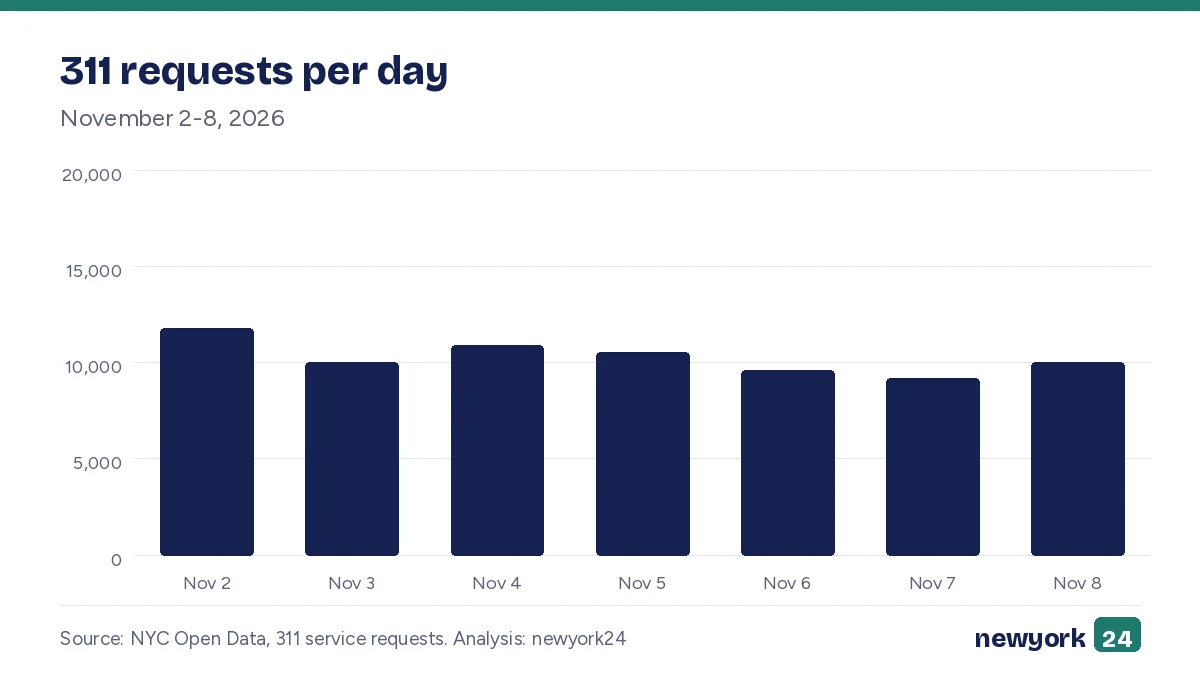
311 requests: November 2-8, 2026
- Requests
- 72,122in the period
- Daily average
- 10,303requests per day
- Busiest day
- November 211,799 requests
- Top complaint
- Illegal Parking13,378 requests
311 received 72,122 service requests over November 2-8, 2026, an average of 10,303 per day.
The busiest day was November 2 with 11,799 requests.
The most common complaint type was Illegal Parking (13,378), then Noise - Residential (6,850) and Heat/Hot Water (4,350).
Total requests: 80,681 in the previous week (October 26 - November 1, 2026); this period is 11% lower.
Total requests: 70,154 in the same week last year (November 3-9, 2025); this period is 3% higher.
| Complaint type | Requests | Share |
|---|---|---|
| Illegal Parking | 13,378 | 18.5% |
| Noise - Residential | 6,850 | 9.5% |
| Heat/Hot Water | 4,350 | 6.0% |
| Blocked Driveway | 3,986 | 5.5% |
| Unsanitary Condition | 3,043 | 4.2% |
Source: NYC Open Data, 311 service requests. 311 data arrives about two days late; a period is shown only after the source has caught up with its last day.
Our storiesData date:
Our stories from November 2-8, 2026
- Stories
- 3in the period
- Most stories
- Weather2 in that section
We published 3 stories over November 2-8, 2026.
By section: Weather 2; City services 1.
| Section | Stories |
|---|---|
| Weather | 2 |
| City services | 1 |
- Central Park reached 72°F on November 4, 2026, 14°F above normal
- 311 heat and hot water requests, October 26 to November 1, 2026
- Central Park high 68°F on November 3, 2026
Source: newyork24 news desk.
Earlier weekly editions
Each edition is published after its period ends and does not change afterwards.