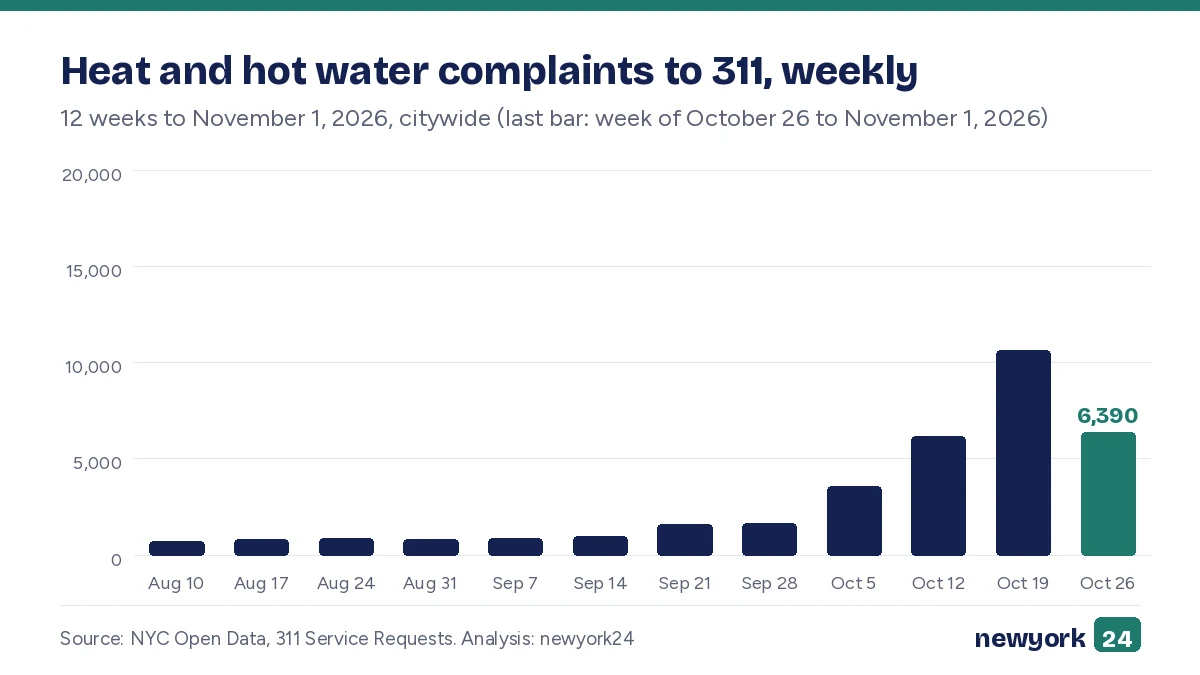
311 heat and hot water requests, October 26 to November 1, 2026
Citywide 311 counts show 6,390 heat and hot water requests from October 26 to November 1, 2026, down 47.7% from the week of October 27 to November 2, 2025. The Bronx led all boroughs that week.
Key figures
- 6,390 requests citywide, October 26 to November 1, 2026
- Down 47.7% from the week of October 27 to November 2, 2025
- The Bronx led with 1,971 requests
- 27,726 requests citywide, October 1 to November 1, 2026
24 News Desk
 Editor: Utku Eroğlu
Published:
Updated:
How many heat and hot water requests came in from October 26 to November 1, 2026?
Citywide, 6,390 requests about heat and hot water were created from October 26 to November 1, 2026. Heat and hot water placed third among all 311 complaint types that week. NYC Open Data's 311 Service Requests records run through November 3, 2026.
Monday, October 26, 2026, recorded 921 requests citywide, and Tuesday, October 27, recorded 888. Wednesday, October 28, recorded 1,163 requests, followed by 701 on Thursday, October 29. Friday, October 30, had 579, Saturday, October 31, had 866, and Sunday, November 1, had 1,272.
How did the week of October 26 to November 1, 2026 compare with 2025 and recent weeks?
The week of October 27 to November 2, 2025, recorded 12,211 requests about heat and hot water. The 2026 week was down 47.7% from that count.
Over the 4 weeks from September 28 to October 25, 2026, the weekly average was 5,514 requests. The week of October 26 ran 15.9% above that average.
The preceding week, October 19-25, 2026, recorded 10,627 requests citywide. Among all 311 complaint types that earlier week, heat and hot water placed second.
Among the 53 weekly totals from October 27, 2025 to November 1, 2026, the October 26 week ranks 23rd, with No. 1 as the highest.
Which boroughs led the October 26 to November 1, 2026 requests?
The Bronx led with 1,971 requests. Brooklyn followed with 1,863.
Of requests recorded with a borough, the Bronx accounted for 30.8%.
The Bronx also ranked first in the preceding week, October 19-25, 2026, with 3,097 requests.
How does the 2026 heating season so far compare with 2025?
The season so far, from October 1 to November 1, 2026, totals 27,726 requests citywide.
This comparison uses matching dates in 2025, not matching weekdays. October 1 to November 1, 2025, recorded 33,296 requests, and the 2026 total is down 16.7%.
Current data on this topic: NYC heat and hot water complaints

Computed figures in this story (17)
Each value's source, query and retrieval time are recorded. Every number in the text maps to one of the values below or to a dated record from the story's sources.
- O1 heat and hot water complaints [citywide, week of October 26 to November 1, 2026]: 6,390
- O2 heat and hot water complaints [citywide, same week a year earlier, October 27 to November 2, 2025]: 12,211
- O3 year-over-year change [heat and hot water complaints, citywide, October 26 to November 1, 2026 against October 27 to November 2, 2025]: -47.7%
- O4 weekly average [heat and hot water complaints, citywide, previous 4 weeks, September 28 to October 25, 2026]: 5,514
- O5 gap to the previous 4-week average [heat and hot water complaints, citywide, week of October 26 to November 1, 2026]: +15.9%
- O6 heat and hot water complaints [citywide, the week before, October 19-25, 2026]: 10,627
- O7 rank of the week among the 53 weeks from October 27, 2025 to November 1, 2026 [heat and hot water complaints, citywide, weekly totals, No. 1 = highest]: No. 23
- O8 No. 1 borough by heat and hot water complaints [week of October 26 to November 1, 2026]: the Bronx, 1,971
- O9 No. 2 borough by heat and hot water complaints [week of October 26 to November 1, 2026]: Brooklyn, 1,863
- O10 share of the top borough [heat and hot water complaints, week of October 26 to November 1, 2026, boroughs with a stated location]: 30.8%
- O11 top borough in the week before [heat and hot water complaints, October 19-25, 2026]: the Bronx, 3,097
- O12 heat and hot water complaints [citywide, heating season so far, October 1 to November 1, 2026]: 27,726
- O13 heat and hot water complaints [citywide, same calendar dates a year earlier, October 1 to November 1, 2025]: 33,296
- O14 change in the season-to-date total [heat and hot water complaints, citywide, October 1 to November 1, 2026 against October 1 to November 1, 2025]: -16.7%
- O15 rank of heat and hot water among all 311 complaint types [citywide, week of October 26 to November 1, 2026]: No. 3
- O16 rank of heat and hot water among all 311 complaint types [citywide, the week before]: No. 2
- O17 the data of the source 'NYC 311 Service Requests from 2020 to Present (data.cityofnewyork.us erm2-nwe9)' runs through November 3, 2026
How this story was made
Numbers and comparisons were computed by code from official open data and verified a second time. An AI-assisted writing tool drafted the text from those facts only; a different model checked every claim against the source. Stories involving named private people, crime, health or elections are never published automatically.